Performance Profiling of XSLT Stylesheet
Whether you are trying to identify a performance issue that is causing your production XSLT transformation to not meet customer expectations, or you are trying to proactively identify issues prior to deploying your XSLT transformation, using the XSLT profiler feature is essential to helping you save time and ultimately ensure a better performing, more scalable XSLT transformation.
The profiling is available for the XSLT processors that are bundled with Oxygen (Saxon 6.5.5, Saxon EE, and Xalan 2.7.1). This allows you to profile XSLT 1.0, 2.0, or 3.0 stylesheets.
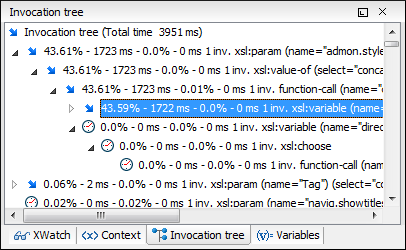
Invocation Tree View
Using the Invocation Tree view, also known as a call tree, you can examine how style instructions are processed in a top down manner. The profiling result shows the duration time for each of the style instructions (including the time needed for its child instructions and, when an instruction is expanded, how the instruction time is composed from the child instruction times).

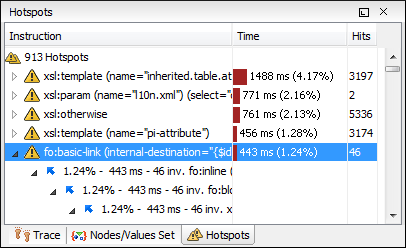
Hotspots View
Using the profiler Hotspots view, you can immediately detect the time the processor spent on each instruction. The hotspot displays the inherent time of the instruction (the total time processing that instruction, minus the time processing its child instructions). When a hotspot is expanded, you can see all the different paths that instructions were called from (a reverse invocation tree), the number of invocations, the instruction time on that path, and the percentage that path contributed to the instruction's total execution time.


